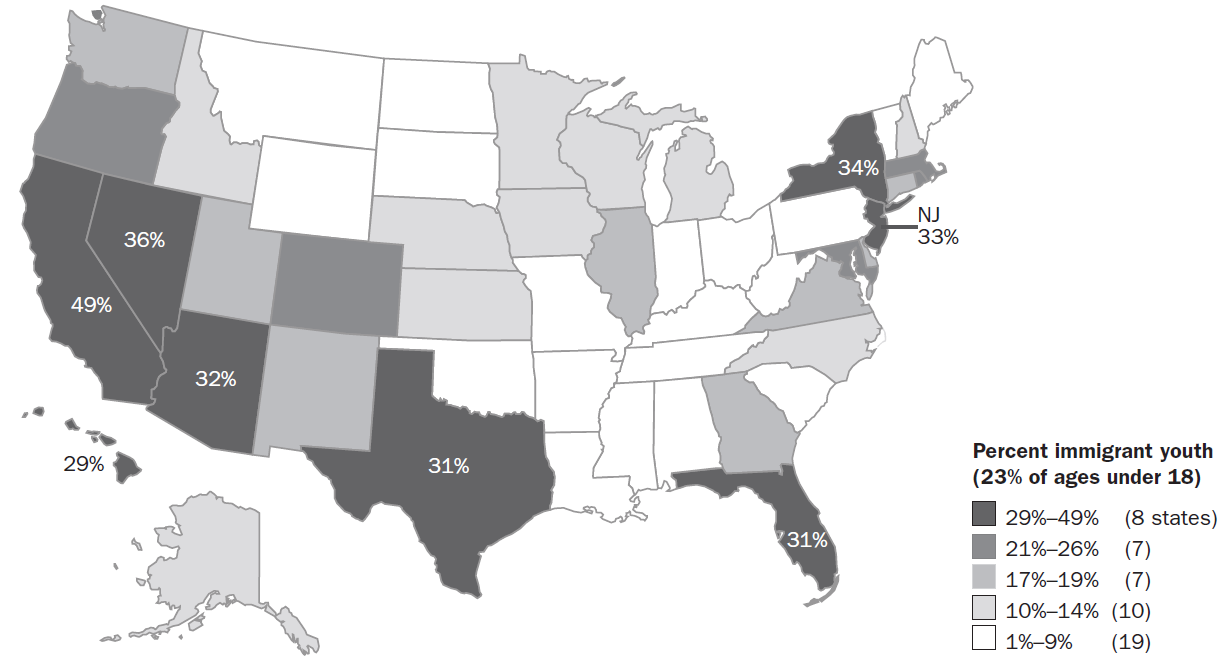
Percent of youth under 18 in state who were children of immigrants as of 2008 [1]
Immigration criteria bring in people who favor big government
…Pew researchers asked if respondents completely agreed, mostly agreed, mostly disagreed, or completely disagreed with the following statements:
- There need to be stricter laws and regulations to protect the environment.
- It is the responsibility of the government to take care of people who can’t take care of themselves.
- The government should help more needy people even if it means going deeper in debt.
- Poor people have become too dependent on government assistance programs.
Responses to these four items form a single factor or scale score, higher values in this case indicating greater approval of increased regulation and redistribution, or opposition to limited government. What explains where respondents score on these questions once they are combined and scaled? Democrats are far more likely to favor an activist role for government than Republicans — and the difference is about a 42-point gap separating “Strong Democrats” from “Strong Republicans”.[2]
…there is a significant negative correlation between the growth in the immigrant share of the population and the Republican vote share in elections for the House.
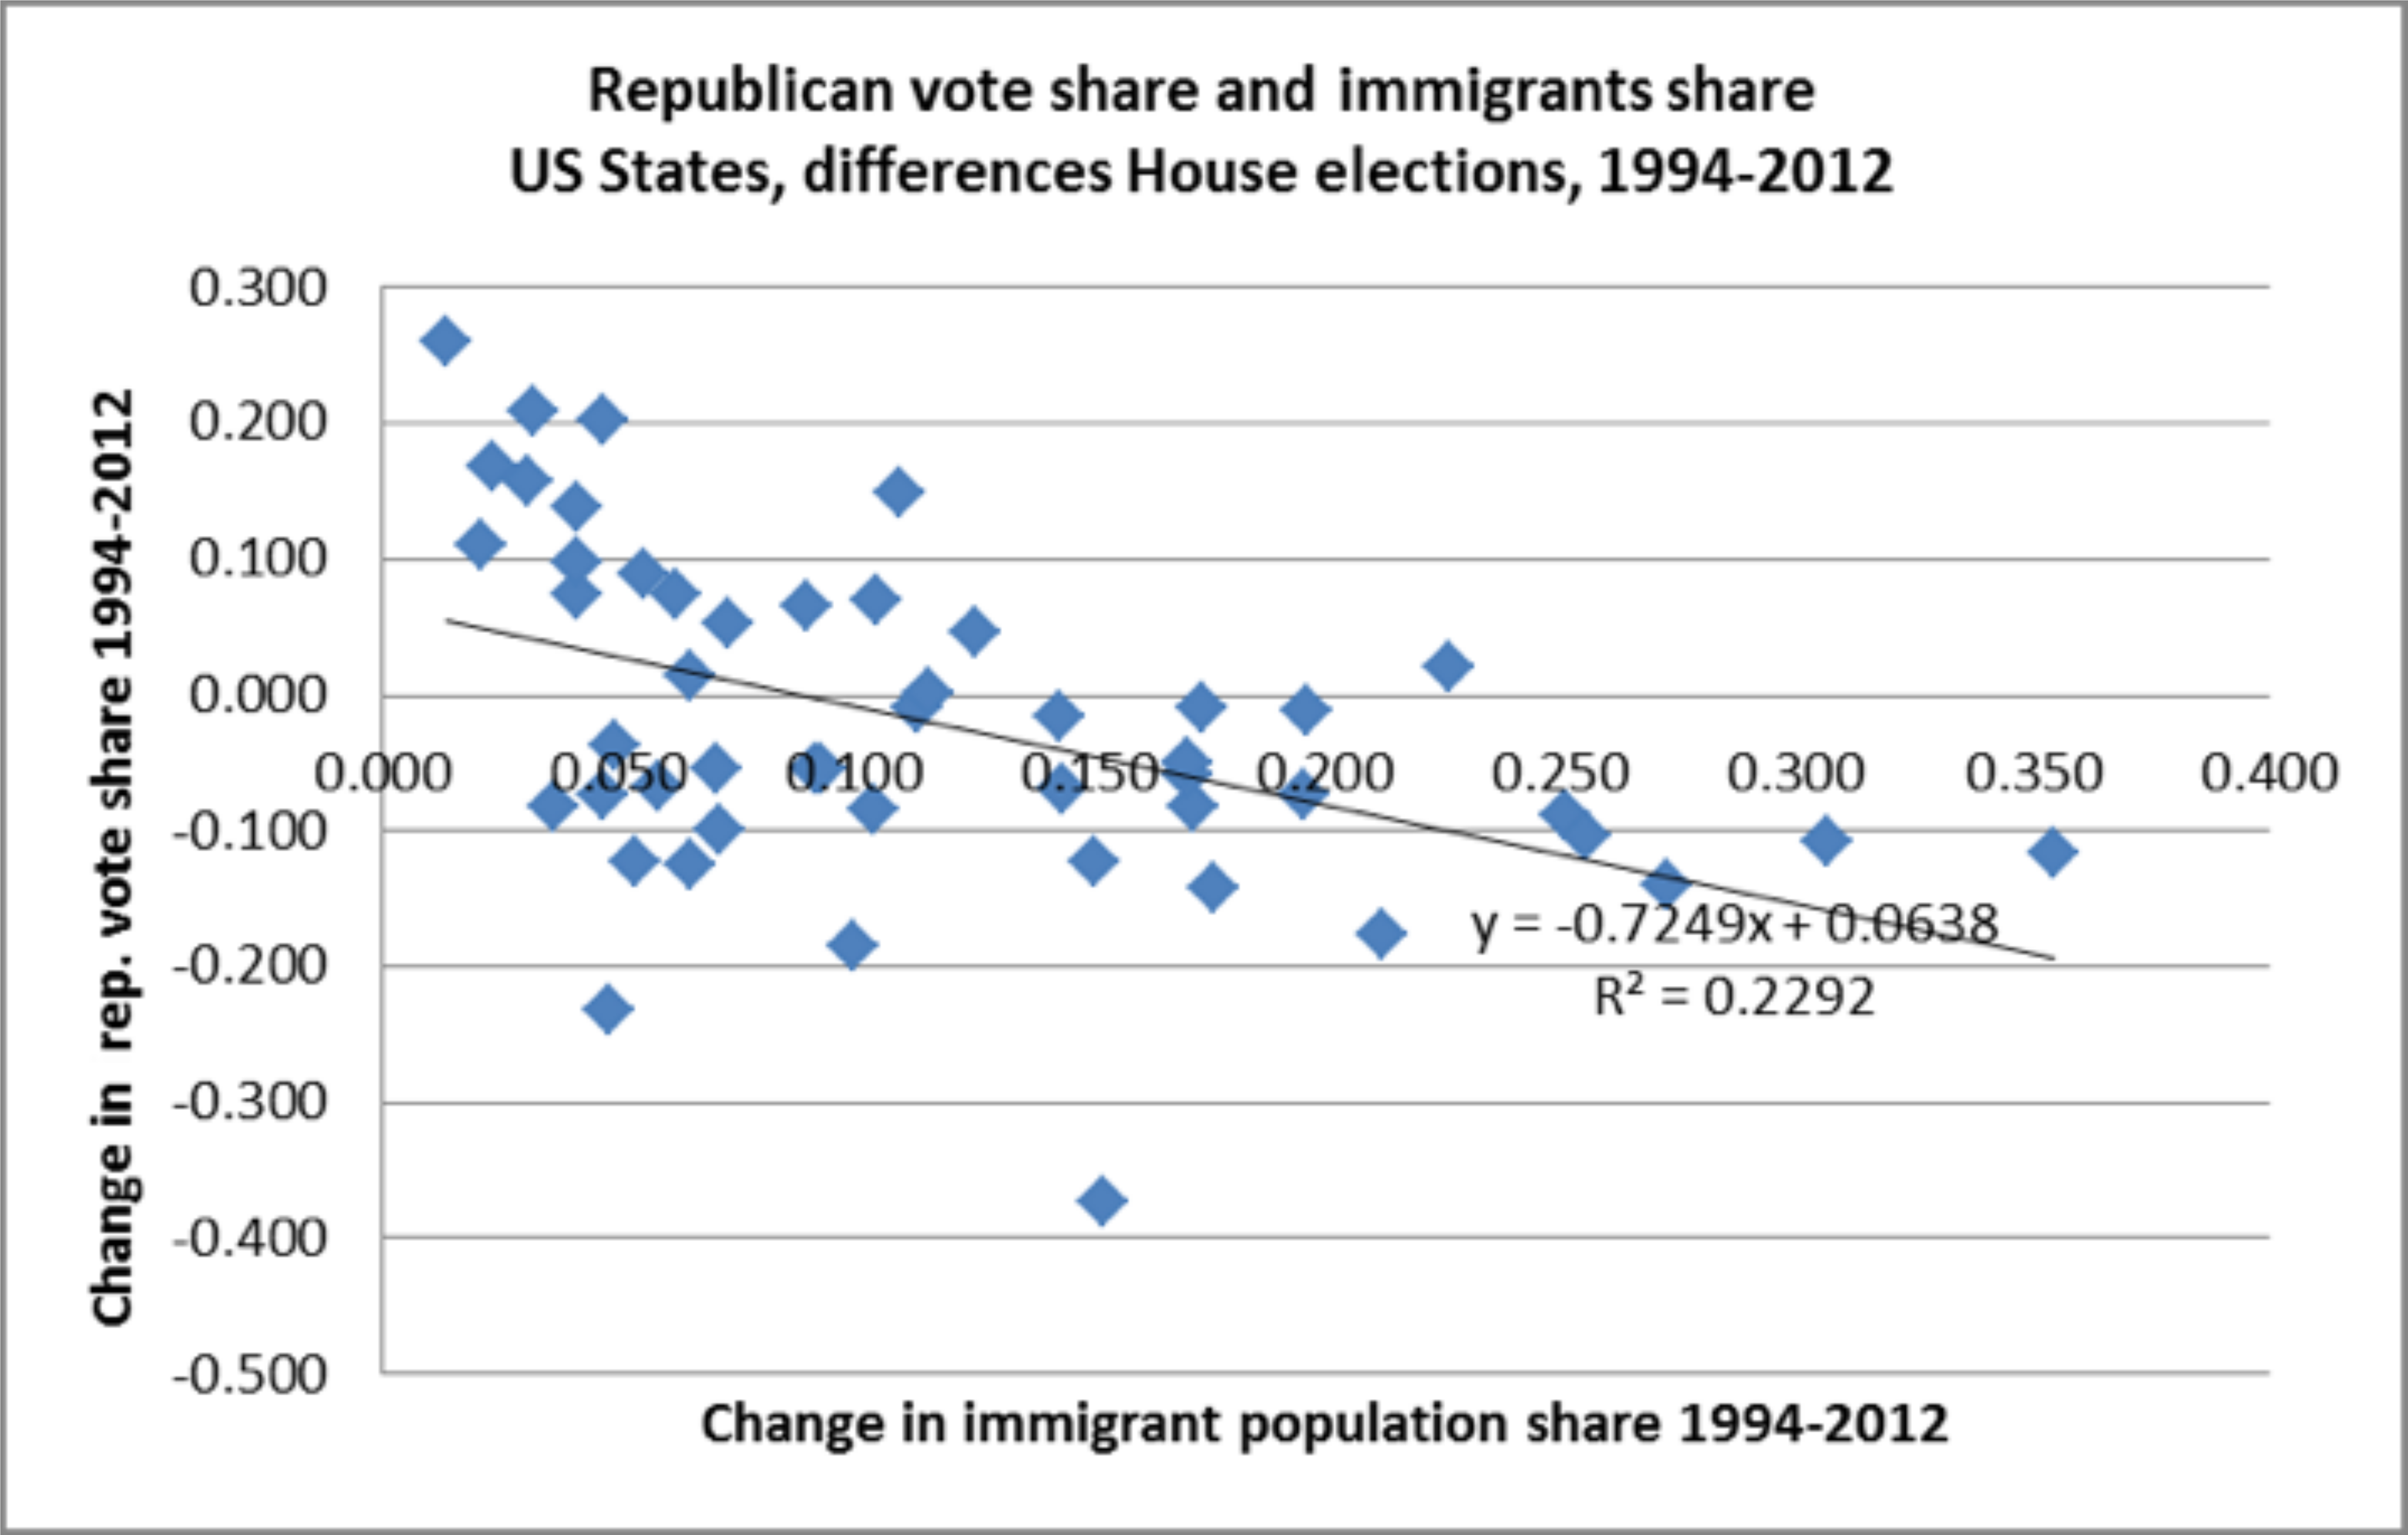
Increasing the immigrant fraction by 1.00% increases the big-government vote fraction by 0.72% [3]
Immigration criteria favor big government for at least 2 generations
About eight-in-ten (83%) first-generation Hispanics say they would rather have a bigger government with more services than a smaller government with fewer services. While still a clear majority, the share opting for an activist government is lower (71%) among second-generation Hispanics.
Among Asian Americans, more of the first generation (57%) than the second generation (47%) prefer a bigger government that provides more services. Second-generation Asian Americans hold views more similar to those of the general public on this issue.
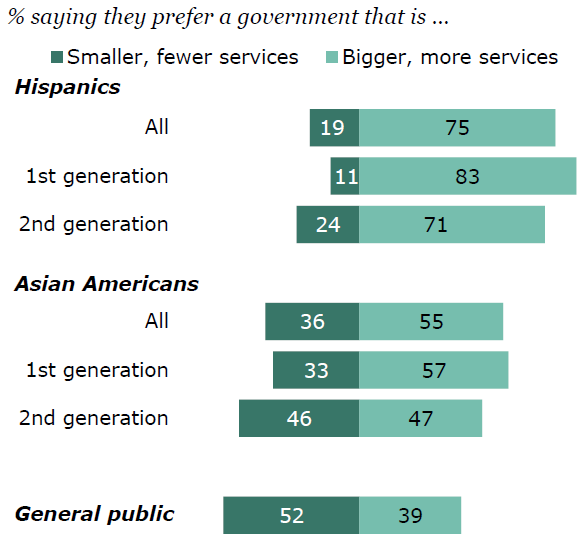
Hispanics and Asian Americans favor big government [4]
The majority of both Muslim Americans… and the general public… favor increased federal government spending to help the needy (73 percent and 63 percent, respectively)…
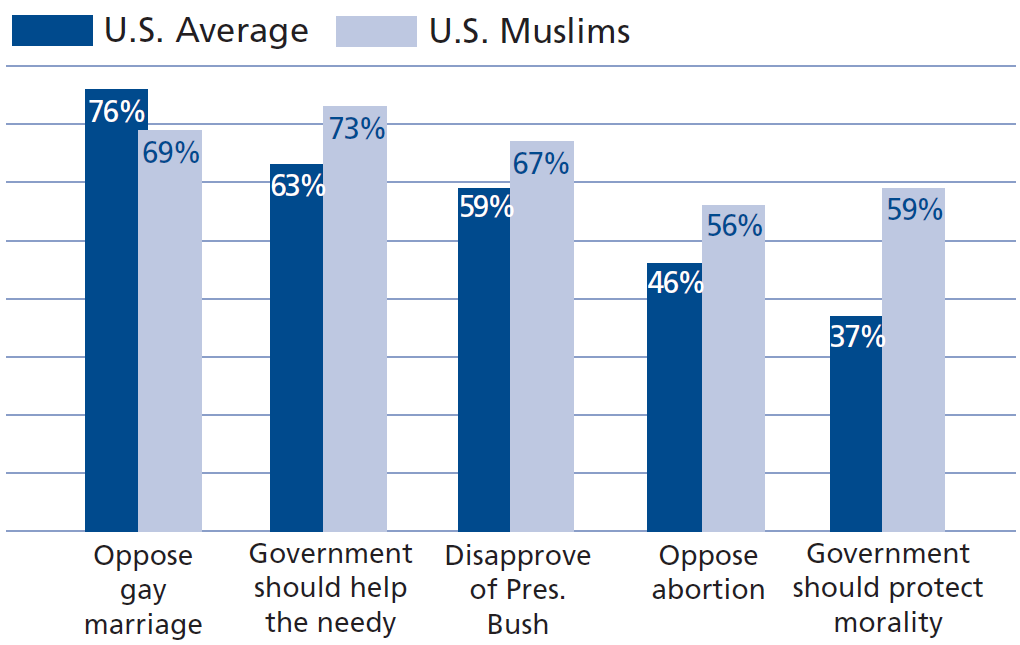
American Muslims favor big government [5]
Immigration criteria threaten citizens’ freedom
Overall, the share of immigrants steadily increased over time. The nationwide average share of immigrants in the total population was 9.1 percent in 1994, rising to 17 percent in 2012.
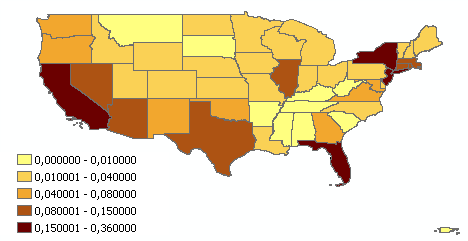
Immigrant fraction per state in 1994
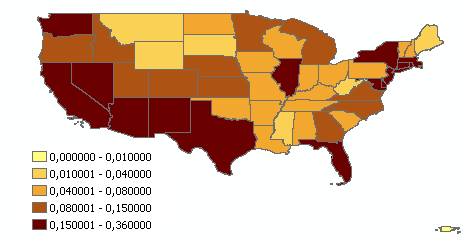
Immigrant fraction per state in 2012 [3]
Immigration criteria swing the vote, rigging elections
Demography is destiny
The past: California
The present: Florida, Colorado, Nevada, and Virginia
The future, near term: Arizona, North Carolina
The future, long term: Georgia, Texas [6]
Using standard statistical methods, this research has estimated the impact of the rising percentage of immigrants across U.S. counties on Republican presidential voting in the presidential elections from 1980 to 2012. Across all U.S. counties, including the many smaller counties, the estimated effect of immigration is to drop Republican vote share about two percentage points. Even in seemingly remote locations with negligible immigrant populations, the effect is sufficient to move a 51 percent county to a 49 percent county. Aggregated over the large number of counties and viewed through the template of the Electoral College’s winner-take-all system of elections, the impact of immigration is easily sufficient, by itself, to decide upcoming presidential elections.[2]
- Passel, Jeffrey S. “Demography of immigrant youth: Past, present, and future.” The Future of Children1 (2011): 19-41; 28.
- Gimpel, James G. Immigration’s Impact on Republican Political Prospects, 1980 to 2012.Center for Immigration Studies, 2014, pp. 4-5, 11.
- Mayda, Anna Maria, Giovanni Peri, and Walter Steingress. Immigration to the US: A problem for the Republicans or the Democrats? w21941. National Bureau of Economic Research, 2016, pp. 12, 13, 46, 48.
- Second-Generation Americans. A portrait of the adult children of immigrants.Pew Research Center, 2013, p. 73.
- Read, Jen’nan Ghazal. “muslims in america.” Contexts4 (2008): 39-43; 41.
- Wolgin, Philip, and Ann Garcia. Immigration Is Changing the Political Landscape in Key States. Center for American Progress, 2013, p. 2.