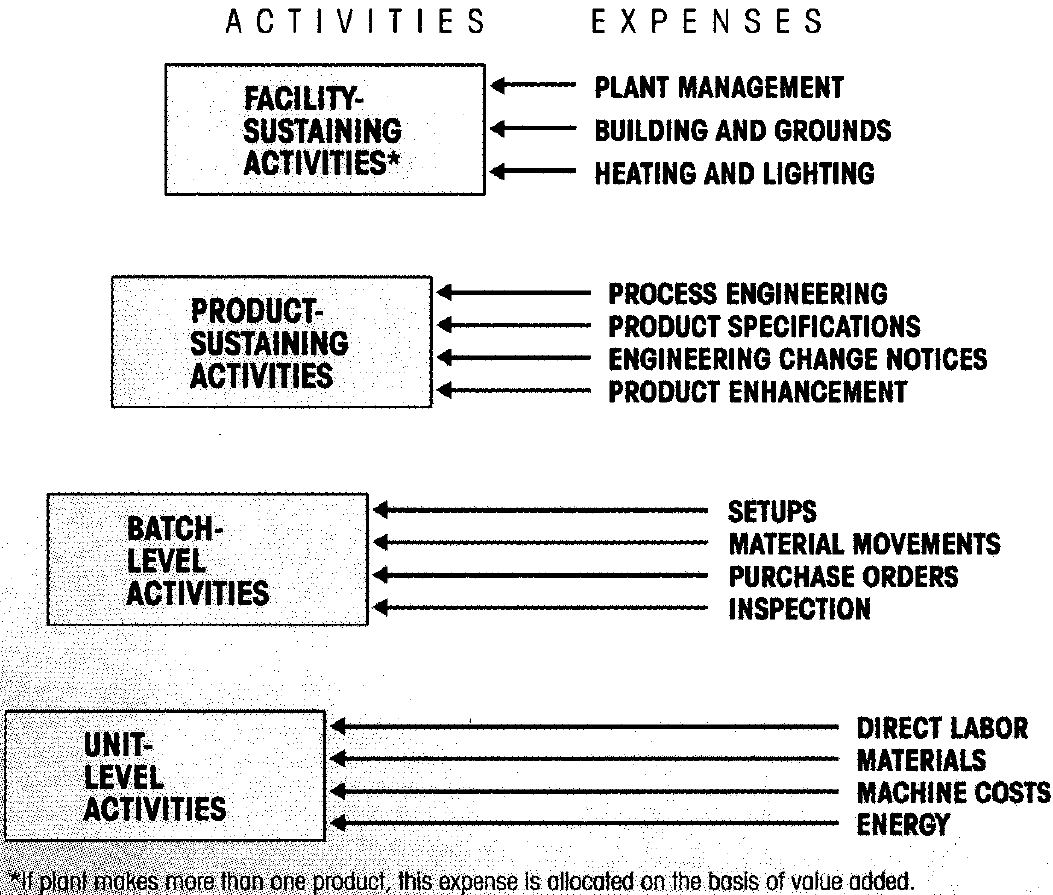
The hierarchy of factory operating expenses
Profit option signals from allocating costs to where value is added
The gross numbers on corporate financial statements… represent the aggregation of thousands of small stories about bow the company designed, produced, and delivered its products, served customers, and developed and maintained brands.
- Some activities like drilling a hole or machining a surface, are performed on individual units.
- Others – setups, material movements, and first part inspections – allow batches of units to be processed.
- Still others – engineering product specifications, process engineering, product enhancements, and engineering change notices – provide the overall capability that enables the company to produce the product.
- And plant management, building and grounds maintenance, and heating and lighting sustain the manufacturing facility.
…managers need to distinguish the expenses of direct labor, direct materials, and electricity, which are consumed at the unit level, from the expenses of resources used to process batches or to support a product or a facility. Batch- and product-level expenses can be controlled only by modifying batch- and product-level activities.
Profit option signals from unit, batch, product, and facility costs
The example of a large equipment manufacturer with a machining shop containing dozens of numerically controlled machine tools shows the important distinction in emphasis between traditional cost systems and ABC analysis.
A detailed ABC analysis revealed that more than 40% of the department’s support resources were not used to produce individual product units. The company developed five new drivers of overhead resources:
- setup time,
- production runs,
- materials movements,
- active parts numbers maintenance, and
- facility management.
The first three related to how many batches were produced, the fourth to the number of different types of products produced, and the fifth to the facility as a whole rather than to individual products.
For a simple drive shaft, for example, the traditional system had allocated $13.38 of factory overhead to every 100 units. For the 8,000 units actually produced, the allocated overhead costs were $1,070. In contrast, the ABC system signaled that production of the shaft consumed about $1,700 of unit, batch, and product-sustaining support resources.
The heavy equipment manufacturer in our example recognized that its low-volume products were a drag on profits. To avoid outsourcing all of the low-volume products, the division opened a special low-value-added job shop.
It went from a single facility producing a broad mix of products to two focused facilities: one for high-volume products and the other for low-volume products.
Profit option signals guide repricing, resource saving, and resource management
Managers should take two types of actions after an ABC analysis.
First, they should attempt to reprice products: raise prices for products that make heavy demands on support resources and lower prices to more competitive levels for the high-volume products that had been subsidizing the others.
Second, and more important, managers should search for ways to reduce resource consumption. Reducing resource consumption gives managers an opportunity to boost profits.
…management can use the freed-up resources to increase output, which in tum generates more revenues. …management can eliminate or redeploy resources periodically to bring spending down to the new lower levels of resource consumption.
….management must take some action to capture the benefits from the signals ABC analysis sends.
- Cooper, Robin, and Robert S. Kaplan. “Profit Priorities from Activity-Based Costing.” Harvard Business Review 69.3 (1991): 130-135.